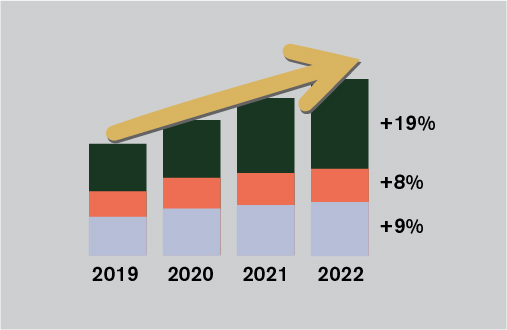
Researchers recently published a study showing that the consumption of artificial sweeteners in Uppsala has increased since 2019.
- We see a yearly increase of 10-20% of the amount of sweeteners in wastewater. The range depends on which sweetener we are referring to. Our study included sucralose, acesulfame, and saccharin, says senior lecturer Foon Yin Lai.
Sucralose, acesulfame and saccharin are common substitutes for regular sugar to add sweet flavor. As they are not stored in the body they are popular in energy-reduced products.
Both above and below health risk thresholds
The results of this study allow the researchers to point out that the consumption of artificial sweeteners can be at a worrying level.
- Although the study shows that overall levels of sweetener consumption are well below WHO and EU recommendations for the acceptable daily intake based on toxicological assessments, new research shows that consumption of artificially sweetened beverages can still be linked to health problems at levels well below this, says Foon Yin.
Combining this with the increasing sales figures of drinks sweetened with artificial sweeteners, the researchers want to draw people's attention to the findings. It also gives rise to further investigations.
As wastewater analyses provide a public health perspective, the results do not apply at the individual level. The health risk that the researchers can point to applies at the population level.
Analysing samples of wastewater from Swedish communities
Analysing wastewater is an established way of monitoring public health and has been used to monitor the usage of illicit drugs and spread of Covid viruses. Now, researchers have used the same infrastructure to study the consumption of artificial sweeteners.
The study shows some localised differences between the Swedish communities from which the samples were taken. The communities of Östhammar, Knivsta, Enköping, Kalmar, Uppsala were included in the study. Samples from the same month were analysed in the study to obtain comparable data.